Introduction:
Best Crypto Chart Macd indicator
As a beginner, we all do not know anything about crypto how to start, or what steps we need to follow in my previous blog you have seen how to start the crypto business if you are new here please go through that blog and read
There are some points that we need to follow to understand the MACD indicator
- First, choose a crypto platform where you can place MACD trading.
- There are a lot of trading platforms available in the market like Captialone binance etc
- play with demo balance
Definition
MACD: It stands for Moving Average Convergence Divergence indicator there are three items in the MACD histogram red line and blue line that you need to analyze to place a trade.
MACD indicator is a type of indicator that involves investors identifying price trends, measuring trend momentum, and identifying entry points for buying or selling
The blue line is called the fastline.
The Red line is called the low line.
Histogram
Analysis
Whenever our blue line intersects from below i.e below the x-axis and crossover, this is a signal for buying in MACD indicator there are two types of trade
- Crossover.
- Divergence.
Crossover
Whenever the blue line intersects from below and crossover you can buy this crossover signal with no guarantee you will get profit so here we are showing you only analysis with no guarantee of profit
Tips: Always maximize your profits and minimize your losses.
Now, here is the question how much time do we hold the trade?
Ans: The answer is the opposite of crossover i.e. whenever the blue line cuts above the histogram you have to sell.
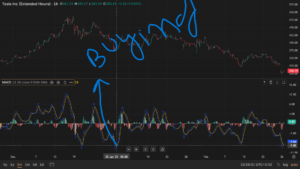
in the above chart, there are two lines blue and red
The blue line intersects the red line but in a downward direction i.e below the histogram, this signal is called the buying signal.
Tips: the indicators only indicate the signals no guarantee of profit
Crossover above histogram
Whenever the blue line intersects the red line above the histogram it shows that you have to sell the trade
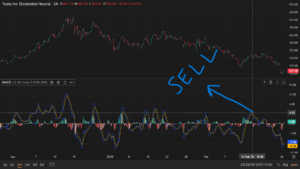
The above diagram shows that the blue line intersects the red line so here is confirmation from the MACD indicator you have to sell
If we look carefully at the above diagram there are 3 confirmations that we need to sell the trade
1. crossover
2. histogram
3. divergence
If you want to learn more please click the link
Some important points regarding the MACD indicator
MACD LINE =12DAYs time-26days time
or MACD=12 EMA period − 26-Period EMA
Stop Loss in Macd Indicator
Stop loss is an important factor in trading if you are aware of this you will not lose money coming to the point where you have put stop loss before one candle of buying/selling trade
let’s take an example
before one candle stops loss
in a trending market with this indicator, there is 70% accuracy but no guarantee for profit but in the sideways market the accuracy might be affected
Best example
iF Stock X drops to 50,then48, but the MACD rises during the second drop. This divergence might mean the downtrend is ending. A trader could buy here, expecting a bounce.
Conclusion: if you are a beginner please do not trade with your real money just trade with your demo account until you have an excellent hold over the crypto trading it is better to trade within with a demo balance
in this world, no one will give the 100% perfect signal everyone provides based on their analysis and experience it is better to do analysis and see thing with your mind